An Interesting Long-term Trend
JAMIE VICECONTE
CHIEF MARKETING OFFICER
CO-CHIEF INVESTING OFFICER
2 min read
We read a lot of content day-in and day-out on markets, performance, relative value across sectors, Fed policy, credit performance in fixed income, inflationary trends, etc. Watching Bloomberg News for their pre-market opening broadcasts, there is a never-ending line of market commentators who are indeed experts in their field (and some whom I know and respect professionally) sharing their opinions on all the issues I referenced above.
Much of the commentary relates to short-term performance expectations for markets, but the longer-term trend discussions are relevant for our investment portfolios. Understanding flows of funds and significant capital movements across geographies and sectors is something we have been looking at of late.
Some interesting pieces have been on broader trends related to portfolio rebalancing out of rising equity markets into fixed income assets. As an aging investing population attempts to reduce an ever-growing equity exposure versus their fixed income allocations, there has been a consistent stream of net selling by individual investors broadly defined. To counter the effects of that selling, corporations have been the net buyers of equities, mostly in technology, and have been borrowing at ever-declining interest rates to fund those purchases. Much of that buying is a function of purchasing for equity awards to employees, but the effect is the same.
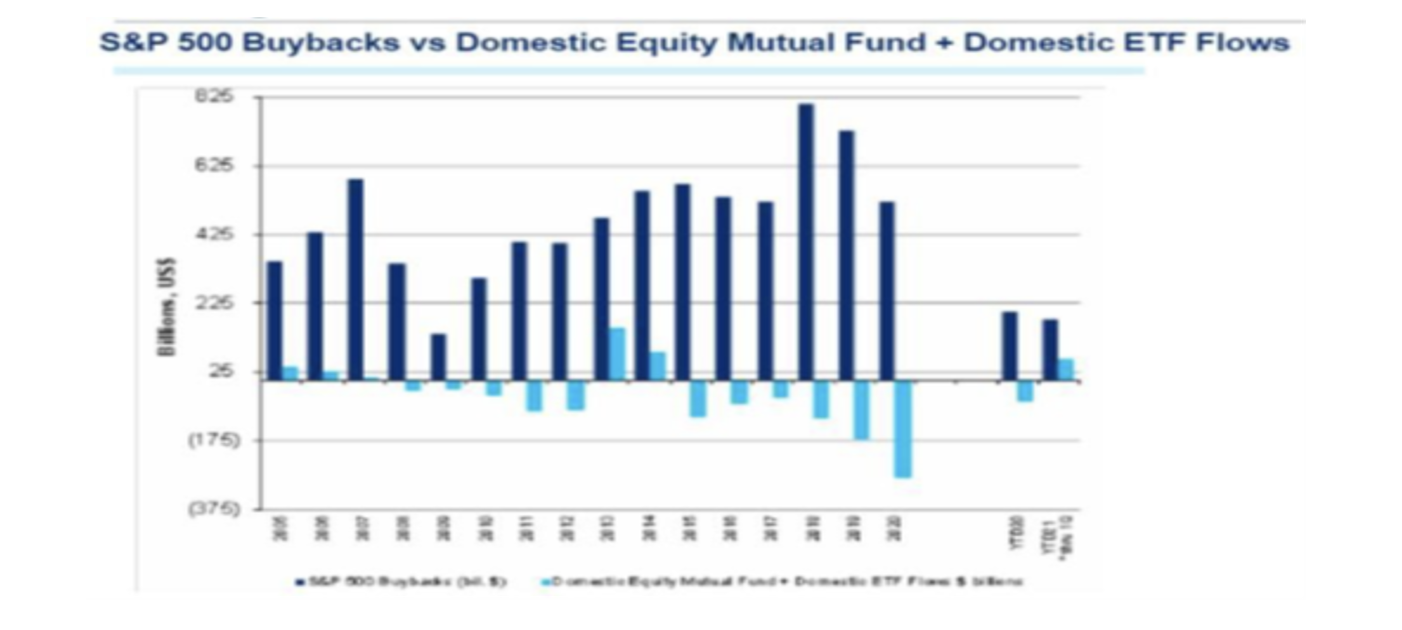
Please see the following page for two charts showing the magnitude of these trends. The first chart shows domestic Equity Mutual Fund and ETF investment flows versus S&P 500 constituent share buybacks. The buyback flows swamp the Mutual Fund and ETF flows by significant orders of magnitude. The second chart shows the percentage of buybacks by industry sector for the S&P 500. Not surprisingly, Information Technology represents the largest percentage of overall buybacks by dollar volume – and this sector has driven a significant proportion of the positive performance of the broader indices over the cycles displayed here.
These flows have driven performance over a full market cycle, with the larger-cap companies in the best position to take advantage of this buyback trend. But trends do end, and given the market’s elevated levels in the largest cap companies, it might be time for other market sectors to take the lead. Making a short-term prediction on when that might happen is what we don’t think anyone can do accurately and why we maintain the exposures we have in our equity portfolios.
Our equity allocations were up roughly 2.0% on the month versus the MSCI ACWI benchmark’s 2.39% return. That leaves us lagging the benchmark by approximately 1.83% YTD. In our Fixed Income allocations, accounts were up 0.86%, beating the Bloomberg Barclays AGG benchmark, which was down 0.19% for July. That leaves our Fixed Income allocations up 5.92% YTD versus the benchmark’s -0.73% return. (We had a bad calculation for our YTD Fixed Income performance last month. The correct number was 5.09%, not 3.13% as we had stated.)